iAspirants
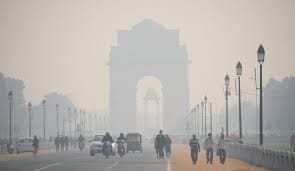
Delhi's Air Quality Crisis Analysis
Published on:
Source: The Hindu
Share this post
Article Summary
Air Quality Report Summary - Delhi (Monsoon Season 2026)
Key Findings:
- Duration of Analysis: The report covers a 92-day monsoon season (June 1 to August 31, 2026).
- Air Quality Index (AQI) Statistics:
- 'Good' AQI Days: 1 Day (July 9) - Recorded when rainfall was 67.75 mm.
- 'Satisfactory' AQI Days: 35 Days (38% of total days).
- 'Moderate' AQI Days: 53 Days (57.6% of total days).
- 'Poor' AQI Days: 3 Days (3.3% of total days).
AQI Scale (CPCB):
- Good: 0–50
- Satisfactory: 51–100
- Moderate: 101–200
- Poor: 201–300
Pollution Dynamics:
- Despite heavy rainfall intended to improve air quality, baseline pollution levels remained high.
- Particulate matter levels increased rapidly within 48 hours post-rainfall, indicating persistent pollution sources.
Expert Commentary:
- Anumita Roychowdhury (CSE) emphasizes that reliance on natural weather patterns for pollution management is inadequate.
- Calls for year-round, comprehensive actions to reduce emissions across all sectors in the National Capital Region (NCR).
Seasonal Pollution Trends:
- Air quality worsens annually during winter due to low wind speeds and temperature drops. Contributing factors include:
- Vehicular emissions
- Road dust
- Stubble burning (peak in October-November)
- Use of firecrackers during festivals.
Implications:
- The report indicates a critical need for proactive air quality management strategies rather than reactive measures that depend on seasonal rainfall patterns.
Conclusion:
- Delhi's air quality remains a significant concern, highlighting the importance of continuous and sustainable emission reduction efforts throughout the year to combat air pollution effectively.
Key Terms & Concepts
| Delhi | Location of air quality study |
| Centre for Science and Environment (CSE) | Study report issuer |
| July 9 | Date of 'Good' AQI |
| 67.75 mm | Mean rainfall measurement |
| 92-day | Duration of monsoon analysis |
| Air Quality Index (AQI) | Pollution measurement scale |
| CPCB | Pollution control authority |
| 0–50 | Good AQI range |
| 51–100 | Satisfactory AQI range |
| 101–200 | Moderate AQI range |
| 201–300 | Poor AQI range |
| NCR | Region affected by emissions |
| Indo-Gangetic Plains | Region experiencing pollution spikes |